Large-scale modelling of distribution networks
How do you build a digital twin, in the form of a dynamic simulation model of a district heating network that contains 46,000 pipes, 9,000 customers and has a range of 20 km, within a reasonable time and cost?
It’s pretty obvious that it would take too long to build the model manually and there would be a high probability of errors. This problem was posed by the EU project OPTi when it started. Optimation took up the challenge to try to build a simulator model. The model also needed to meet a number of criteria in order to be useful in the various scenarios that would be investigated. This would include control of differential pressures at certain points in the network, temperature distribution in the grid depending on the flow and a number of losses in pipes. Other participants in the project worked with modelling of pilot models of specific customers where indoor climate and outdoor temperature were recorded.
Luleå Energi’s entire district heating network was designated as a test facility in OPTi
On the basis that all pipes and customers throughout the network were stored in a GIS (Geographical Information System), along with how the pipe and customers are connected to each other, it was possible to automatically create a model. A model is by definition a simplification of reality. Therefore, one can also assume that the model can be simplified further, as long as it still adequately describes reality. From the GIS, data for the pipe, customers and junction points are transferred to a separate SQL database where the data can be processed with a number of simplification algorithms. For example, pipes connected in series are converted into a single pipe and residential areas with similar co
nsumption patterns are simplified to one consumer. Pilot models and measurement points were reserved, so that they remained unique. When all desired simplifications are made the contents of the database are converted into a model in the format that the simulation program can handle.
With the help of a graphical user interface it is possible to generate and refine the model step-by-step into a finished model. The model can then be in
spected visually in Dymola and, if necessary, be altered manually.
In a dynamic model it is possible to study phenomena and interact with the model
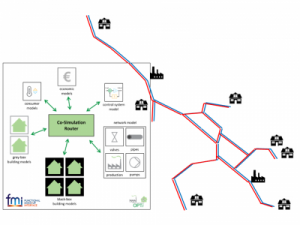
To use a dynamic model a communication interface is needed. It is possible to choose between several different interfaces. In OPTi it was decided that FMI (Functional Mock-up Interface) would be used for communication between models.
In a dynamic model, unlike a static model, it is possible to study phenomena and interact with the model. In OPTi the model has been used to investigate superior control, optimization of the supply temperature curve and optimization of user flexibility (demand response). The same methodology can be applied to any large-scale distribution network.
The biggest gain is that a new model can easily be generated within a few hours with the help of a few button presses, for example, if you want to study how a proposed new pipe would have an impact on the system.
Read more about the project here